Introduction #
A logic analyzer is an electronic measurement device that records and displays digital signals and also has the ability to decode specific protocols. It can trigger on specific logic, display signals, and perform various time measurements. A logic analyzer is a very helpful measurement device in the development of digital electronic circuits. It has the advantage over the oscilloscope that it usually has many more measurement channels, since communication protocols or bus systems often have a large number of signals. Unlike oscilloscopes, logic analyzers digitize signals and display them only as 1/0 or high/low.
This article is about a cost-effective logic analyzer (LA5016) from Kingst. We will not only look at key parameters and technical details but also analyze and debug a self-developed microcontroller program.
Kingst LA5016 #
As described in the introduction, the LA5016 is a cost-effective (~300€) logic analyzer controlled and powered via USB. Kingst also offers other products: LA1010, LA2016, LA5016, LA5032. All these devices are very similar, differing only in the number of channels, sampling rate, and memory depth. You can compare the devices on the Kingst product page.
Back to the LA5016 and its key parameters:
- Input channels: 16
- Sampling rate: 500MHz
- Bandwidth: 80M
- Memory depth: 2 GBit (+Stream Mode, with reduced sampling rate)
- Input voltage: +/- 50V
- Adjustable trigger voltage -4/+4V in 10mV steps.
- PWM output channels: 2
- Supported decoding of the following protocols: UART/RS-232/485, I2C, SPI, CAN, DMX512, HDMI CEC, I2S/PCM, JTAG, LIN, Manchester, Modbus, 1-Wire, UNI/O, SDIO, SMBus, USB1.1, PS/2, NEC InfraRed, Parallel, etc…
With 16 measurement channels, this logic analyzer provides a solid foundation for working with electronic circuits. These 16 signals can be sampled with a time resolution of 500MHz. The manufacturer specifies a bandwidth of 80MHz, meaning you should not apply signals higher than 80MHz. It is tempting to think that the sampling rate should be sufficient for much higher signals, but you must never forget that you need a certain amount of oversampling. Another reason for the bandwidth limitation could be the wiring of the channels, their input capacitance, and the associated load, which does not allow faster signals. Often, the logic built into the devices is not fast enough; it samples at 500MHz, but can store only 100 million values per second. Bandwidth is a very interesting and complex topic, important for the user: Do not exceed the bandwidth, as it can lead to incorrect measurement results!
Another important and usually expensive parameter is the memory depth. It defines how many measurement points can be recorded. Depending on the combination of the number of channels and the sampling rate, this results in a certain time during which a signal can be recorded. An example: Using a memory depth of 1MSa (1 million samples) at a sampling rate of 1MHz, you can sample for 1 second. If you increase the sampling rate to 50MHz, you can only record for 20ms. The good news is that you don’t have to worry much about this during use, as the software indicates how long you can measure or record with the selected parameters.
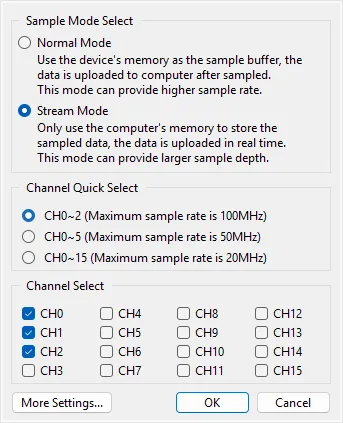
Another very interesting feature of the LA5016 is that it has a Stream Mode. This means that the memory depth of the device can be completely ignored because the measurement points are transmitted directly, i.e., “live,” to the PC. The limiting memory depth is then the PC’s RAM, which usually offers more than enough storage in modern systems. Caution: the sampling rate is limited depending on the selected number of channels.
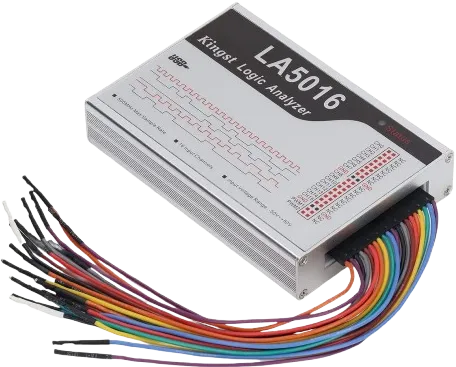
Scope of Delivery #
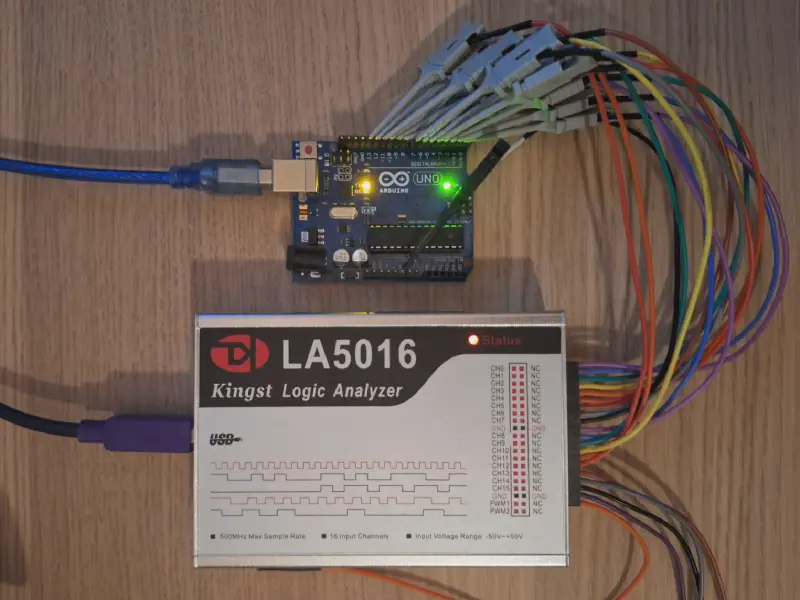
The LA5016 comes with a USB-A/B cable, color-coded cables, simple test probes, a minimal manual, and a CD. No additional power supply is needed, as the device is powered directly via the USB bus. Everything is included in the package to start measuring right away.
Software #
Since this is a USB device without any display elements (except for a status LED), you can only use it in conjunction with a PC. The manufacturer provides the software. If you prefer to use open-source software, you can do so with PulseView (Sigrok). I have looked at both options and shortly summarized them.
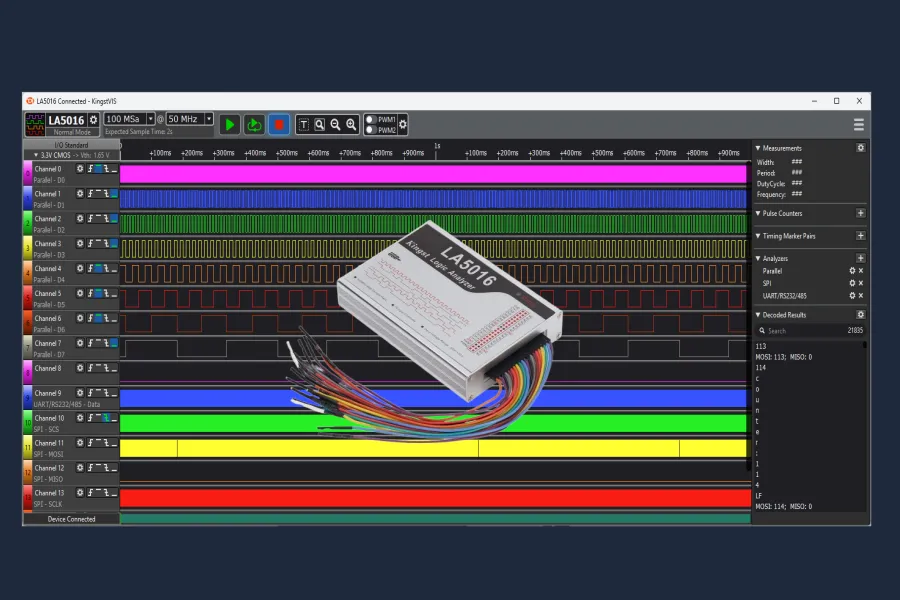
Kingst VIS (Manufacturer) #
Version used: Kingst VIS Version 3.6.4
Kingst VIS is the manufacturer’s own software, running on Windows/Linux and Mac.
The software looks modern and very pleasant. It is easy to use, and you can quickly find your way around. Setting the sampling rate and memory depth, combining different triggers, automatic measurements, using markers and time measurements, protocol analysis, … all these features are integrated and easy to find and use.
PulseView (Sigrok) #
Version used: Sigrok PulseView 0.5.0-git-32ca796
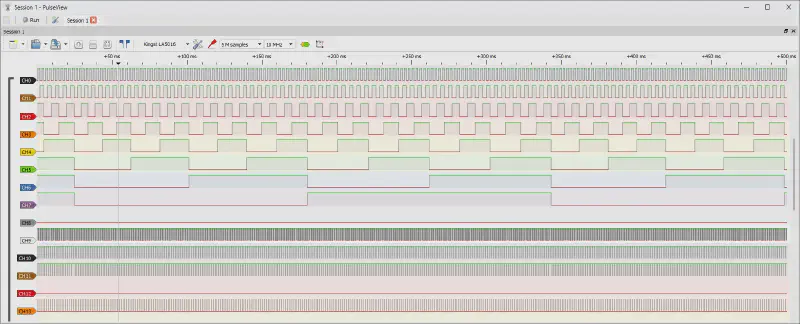
PulseView is an open-source software that supports not only Kingst devices but also many other devices and DIY logic analyzers. For more advanced users, there is even sigrok-cli, a command-line interface that allows you to control various devices. This makes it possible to measure in a terminal or use this terminal as a basis for your own software implementations.
Comparison of the Software #
Kingst VIS #
- +Easy to use
- +Channel colors match the cable colors
- +Search in the decoder
- +Faster and more precise work with markers
- +Multiple marker pairs available
PulseView #
- -More clumsy operation
- -PWM channels can be included, but I couldn’t find how to use them
- -Snapping of markers not as “smooth”
- -Only 1 marker pair available
- -Parallel decoder only in hexadecimal
- -Often problems connecting to the LA5016
- -Saved sessions do not restore the project 100%
- -Dark theme very unreadable
- -Does not show the recording length when selecting the sampling rate and memory depth
- +Decoder as a separate data track and detailed view
- +Freely configurable channel colors
- +More precise placement of markers as you can see the sample times
- +More protocols
- +Very open and freely configurable
Basically, both applications are excellent for measuring, debugging, and working. Personally, I prefer Kingst VIS a bit more because it feels more comfortable to use. Saved sessions can be perfectly restored, you can search for values in the decoder, and the two PWM channels of the LA5016 are also usable. Therefore, the following application examples will only be demonstrated using Kingst VIS.
Using the LA5016 Arduino Uno Test Program #
As a basis (for debugging and “playing”), a microcontroller program is used, for which an Arduino Uno was used and equipped with the following features:
- main loop that executes approximately every 500us (500us wait)
- 8-bit counter that counts up continuously
- the 8-bit counter is output on PORTD of the Arduino Uno
- “Counter:X” is output via a serial interface (Pin 8/9 or PB0/1), where X represents the value of the counter
- the counter value is output via SPI
The source code is available here. It is implemented with VS Code and the PlatformIO add-on. Help and instructions are available here.
Before measurements can be taken, the LA5016 must be connected to the Arduino Uno. It doesn’t matter how, because the decoders and thus the assignment can be set completely freely in the software. To understand the following images, it is helpful to know which channel is connected to which pin.
| Arduino | LA5016 | Function |
|---|---|---|
| Pin0-Pin7 | CH0-CH7 | Counter output on PORTD |
| Pin8 | CH8 | UART - RX |
| Pin9 | CH9 | UART - TX |
| Pin10 | CH10 | SPI - SCS |
| Pin11 | CH11 | SPI - MOSI |
| Pin12 | CH12 | SPI - MISO |
| Pin13 | CH13 | SPI - SCLK |
Sampling Rate and Memory Depth #
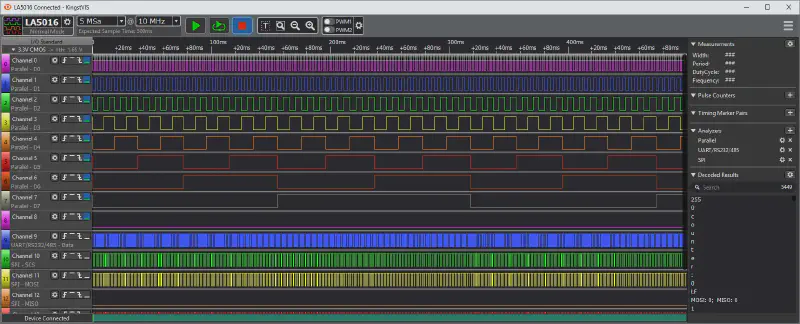
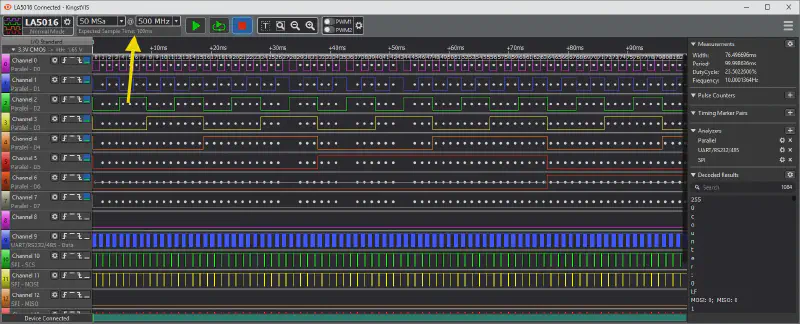
As described earlier, the measurement duration (yellow) results from the sampling rate (green - Sample Rate) and the memory depth (red - Sample Depth). Kingst VIS calculates the recording duration directly after the selection, which is very helpful because you know how long a signal can be recorded before you start a measurement.
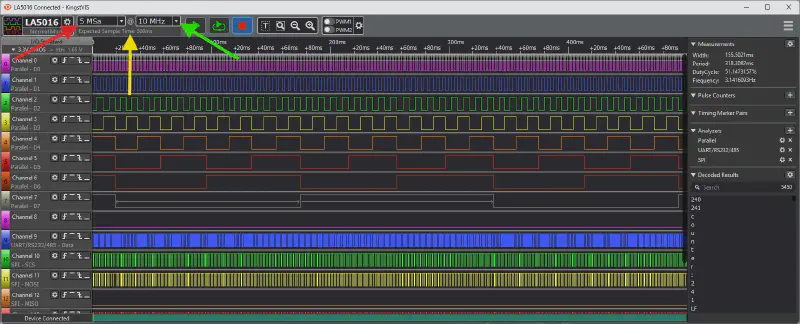
In the example, you can see that you can record 500ms with 10MHz and 5 million memory points. If you change the memory depth to 50 million samples, 5 seconds of data can be recorded (with constant sampling rate).
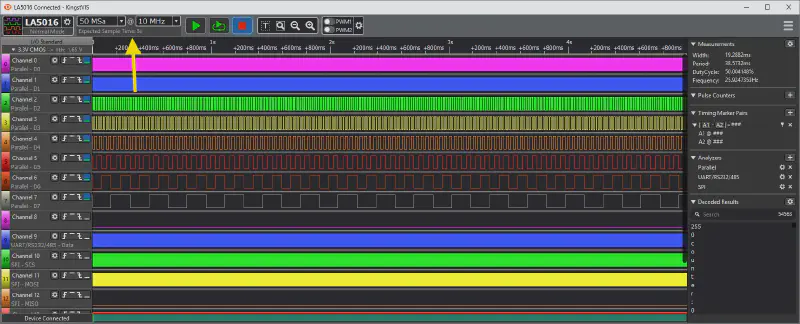
If you now increase the sampling rate to the maximum of 500MHz, the recording duration decreases again to 100ms.
Trigger #
Triggers are events that start a recording. In the case of the LA5016 and Kingst VIS, there are the following triggers: rising edge, high, falling edge, and low. You can place these triggers on a specific channel or combine these events across multiple channels.
For example, if you want to analyze an SPI command, it is advisable to trigger the chip select channel with a falling edge event (assuming CS active low). The logic analyzer is armed and starts its recording when the event (falling edge on CS) occurs.
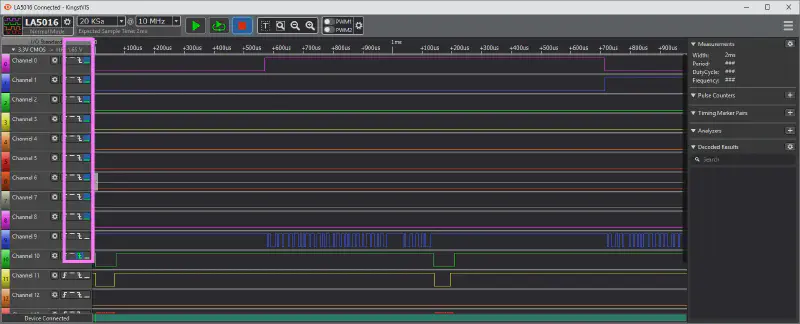
In the example of our Arduino Uno test program, it looks like this:
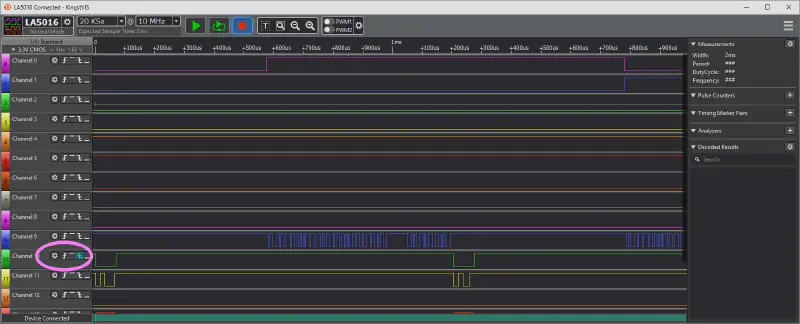
CH10 is the chip select channel, on which the falling edge trigger is configured. You can then see that this edge is exactly at the time zero point. In the pink marker, you can see the channel settings (gear) and the previously mentioned different trigger types: rising edge, high, falling edge, and low (from left to right).
If you want to trigger when the SPI output starts and the counter is at 0, you can do the following: Channel 10 (Chip Select) trigger on falling edge and Channel0-7 (counter) all set to low. Since PORTD represents the counter value and binary 0 = 0b00000000, this corresponds exactly to the value at 0.
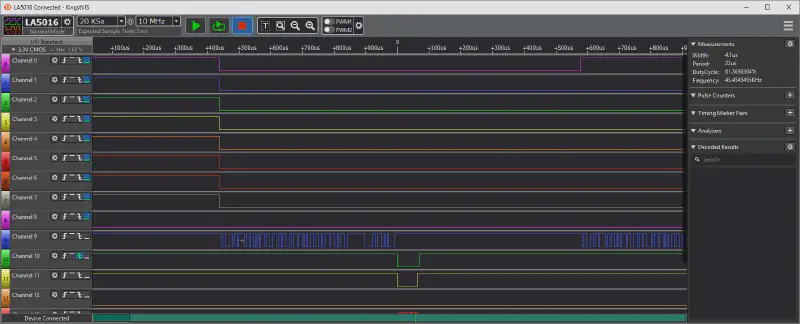
With such trigger combinations, you can specifically look at the events you are really interested in. Often it is important to see what happens shortly before the trigger; which can also be set. To do this, you have to change the trigger position in the device options. For example, if you set the trigger position to 50%, 50% of the memory depth is filled before the trigger and 50% after the trigger.

This means that the time zero point is now in the middle of the signal, and you see the same amount of signal around the zero point/trigger point.
Task: Measuring the Counter Frequency #
We know that the main loop waits 500us, then counts up the counter and outputs it on PORTD. Then UART and SPI are sent, and then this procedure is repeated. The task now is to measure this time, for which there are several options: mouse over or using markers.
The beginning is always the same: set sampling rate, memory depth, define trigger, and start measurement. A suitable trigger for this is either a rising or falling edge on Channel 0. Channel 0 represents the LSB (least significant bit) of the counter, and thus it is also known at what rate it counts up (the time between two edges, falling-rising or rising-falling).
Mouse Over: Kingst VIS has the option to move the mouse to the position that interests you, and a few different measurement parameters are displayed live (right under “Measurements”).
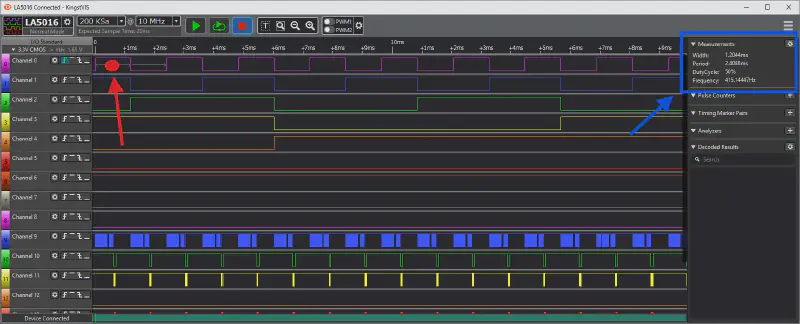
The red dot marks the position of the mouse pointer. The measurement results can be seen in the blue marker. The width (With) of the selected signal section is 1.2ms.
Marker: With markers (Timing Marker Pairs - blue marker), you can manually measure times, even if they are from one channel to another, and at the latest in this case, there is no way around using markers. To start a manual measurement, you only have to add markers (red marker (+)). You can then activate them (green marker) and place them at the desired signal positions.
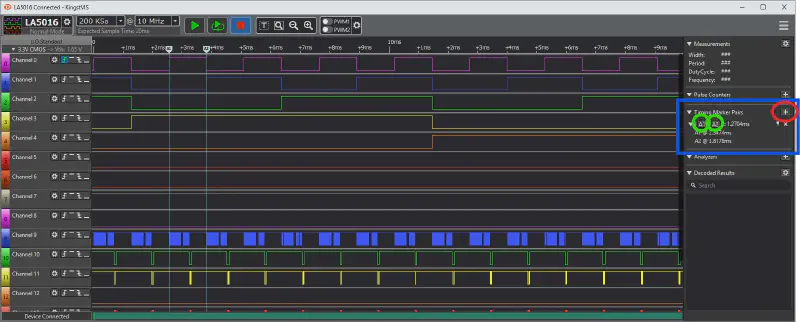
The measured time can be read next to the marker: 1.2704ms. The absolute positions of the markers are also displayed below. You can add multiple markers via the “+”.
Task: Decoding the Counter and Triggering on Value 113 #
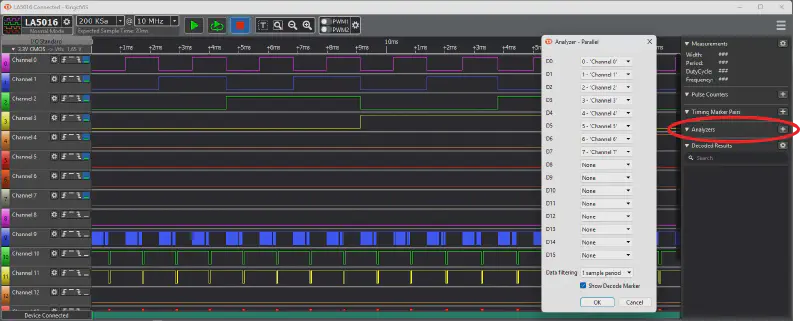
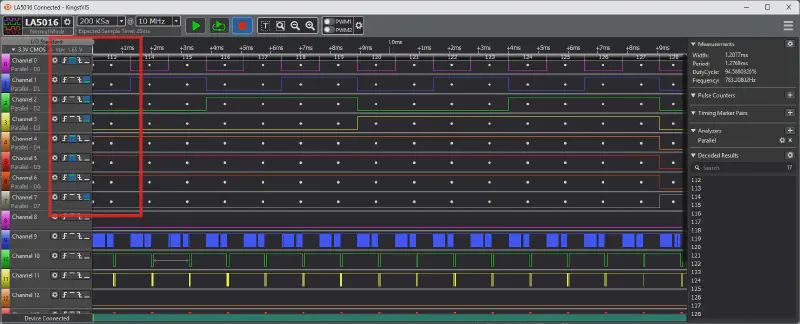
To decode the 8 bits of the counter, Kingst Vis provides a suitable analyzer. To add it, you have to click on the “+” under Analyzers on the right side, select Parallel, and then assign the channels. D0 would be Channel0, D1 Channel1 …. D7 - Channel7, so we would have assigned the entire PORTD(8bit) of the Arduino.
If you confirm the “Analyzer Parallel” window, you get the defined channels displayed decoded. The value “hides” in Channel 0. If the display does not fit, the data format can be changed at any time (Hex, Dec, …). To do this, simply click on the gear at the analyzer and select the desired display under “Display Format”. I set it directly to Dec - decimal, the easiest to understand for us humans ;)
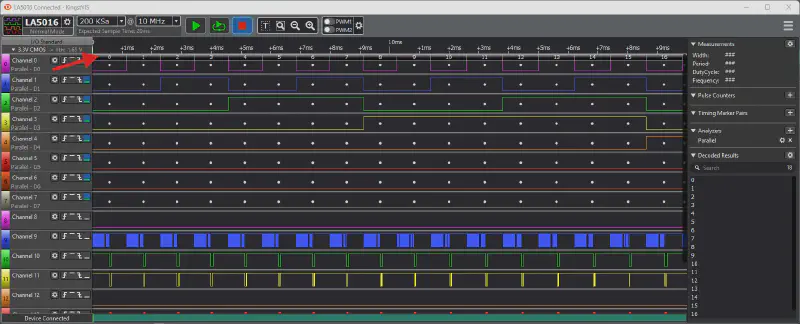
You can now clearly see that the counter is at 0 at the trigger point/zero point, and counts up with each edge at CH0.
If you now want to trigger on a counter value of 113, for example, you only have to convert this number into binary format and enter this code as a high / low trigger. 113 would be binary 01110001.
From this information, we conclude that we define the following sequence as a trigger (CH0 - CH8): high, low, low, low, high, high, high, low. If that was too fast for you: the trigger sequence is simply 01110001 (113) mirrored -> 10001110 and then 1 replaced with high and 0 replaced with low.
Congratulations! Now we have also successfully triggered on a certain counter value. Triggers are very helpful, and their logical combination opens up a lot of possibilities.
Task: Decoders for UART and SPI #
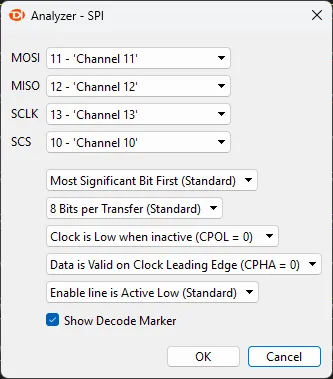
Adding SPI and UART analyzers is as straightforward as adding a Parallel Analyzer. Simply click the familiar ‘+’ (under Analyzers), select SPI, configure it, and click OK. Ensure that the channels are mapped correctly and that CPOL=0 and CPHA=0 are set; then, it should function properly. CPOL and CPHA define how data is shifted into and out of the chip. In this case, data is shifted into the chip on the rising CLK edge and shifted out of the chip on the falling edge.
Now MISO and MOSI data are also decoded and displayed in the corresponding channels.
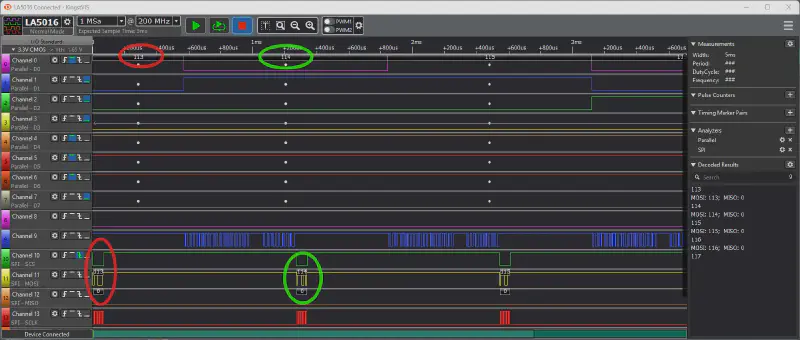
You can now clearly see that the SPI decoded values match the parallel decoded values (red-red, green-green). MISO does not display any data because no other IC is connected to the SPI; the communication is only forwarded to the logic analyzer, which logically does not respond ;)
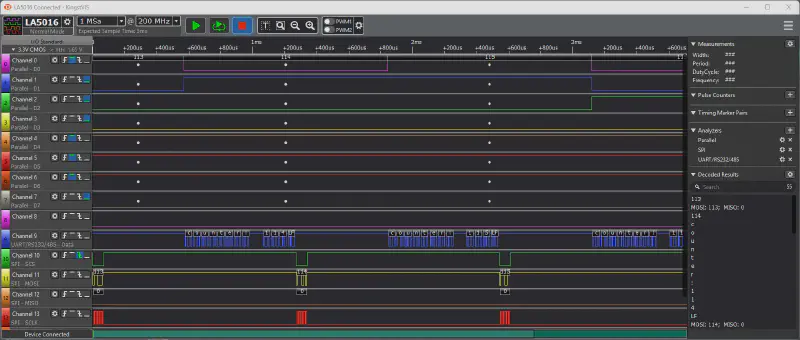
Now we have to decode channel 9 (blue signal). This signal is the TX line of the UART protocol. Same as before: add analyzer. Select “UART/RS252/485” and follow the configuration:
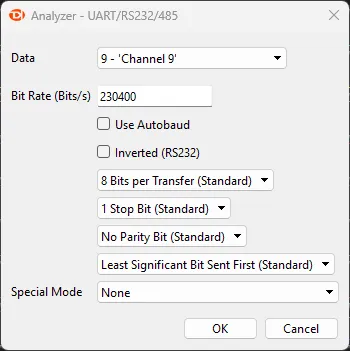
The baud rate is important here - it should always match the speed used in the source code. If you don’t know it, you can also use “Use Autobaud”.
With the UART analyzer, it is advisable to set the display format to ASCII, as it is common to send strings/chars via this interface. Now you get an interpretation of the data displayed directly in the channel. As you can see, the data transmitted via UART also matches that of SPI and the counter output on PORTD.
Summary #
The LA5016 offers a cost-effective and convenient way to perfectly debug, analyze, and optimize your electronic projects. With the included software, you get an easy-to-use tool that allows you to quickly and efficiently analyze circuits. This article only touched on a few functions of the logic analyzer; there are many more applications and possibilities to use this device. Perhaps we can look forward to more articles, projects, and practical applications in the future, as the possibilities are almost endless.
If anyone owns the LA5016 and wants to save themselves the clicking, there is the configuration file, which can be loaded directly into Kingst VIS. It contains all the analyzers and settings that were used here.
I wish you a lot of fun debugging, developing, and optimizing!